
Readers were asking us questions about post-pandemic reports on the state of the nation and in our October post we took a fresh look at the overall NFP sector and noted that fewer Canadians are giving charitable donations – a trend that has continued for decades. This month we wanted to take a fresh look at the latest statistics on who is giving in Canada and new research about changes to giving behaviours. Later this month we will also look at the larger consumer trends impacting the sector.
Fewer Canadians Are Donating. Those who do are older, educated, married and may attend religious services.
Since 2005 we have seen a 15% drop in the number of Canadians reporting a charitable donation on their tax returns (over 860,000* fewer Canadians). The good news is that over that same period, the median donation has increased from $240 to $360 (2021) and the overall revenue from donations remains around the $10 billion annual revenue mark.
*It is important to note that married tax filers are allowed to claim their pooled donations on one spouse’s tax returns, driving down the total number of filers and increasing the amounts claimed. However, we are continuing to compare annual tax filing data with the 2007, 2010, 2013 and 2018 SGVP / GSS studies. Also, Stats Canada data does not take inflation into account which was 3.4% in 2021.
Before we look at how behaviours have changed, let’s first look at the facts about “who” donates.
- Since the 2007 Survey of Giving, Volunteering and Participating (SGVP, Stats Canada), those who gave the most were more likely than others to be older, to have higher household incomes and more formal education, to be married or widowed, and to be religiously active. This remained consistent with the 2010, 2013 (when SGVP merged to become GSS) and 2018 surveys.
- No surprise, lifestage is a factor and donations tend to increase with age and income (kids, careers, debt…) (Donations by Age, 2018 SGVP)
- Donations also correlate with education as well as income – 75% of Canadians with a university degree reported donations.
- The number of male donors peaked in 2005 and until 2014 the majority of Canadians claiming donations on their tax returns were men. As of 2021, 53% of reporting donors were female (up from 40.8% in 2014), 47% male. However we also need to consider the amount donated. In 2020 men claimed $6.7 billion in charitable donations, compared to $3.9 billion reported by women.
Major donors are significant – Growing from 10% to almost 30% of donors
In the 2007 Survey of Giving, Volunteering and Participating (SGVP, Stats Canada), 10% of donors donated over $1,002 and represented 62% of the total value of donations.
In 2021 this grew to 28.8% of all donors donating over $1,000. Donors continue to be older and concentrated among Canadians with higher incomes, with about $9 of every $20 donated coming from Canadians over the age of 65.
While we track donations of $1,000 and above, generally nonprofits categorize major donors as those giving significantly higher amounts. KCI reports that for community organizations, major gifts are often over $500,000 and include both corporate and individual donors.

How we give
Various reports show that Canadians give to several charities each year. The 2021 AFP Survey conducted by Forum Research indicated over 85% of Canadians give to more than one charity, and 45% give to 4 or more causes.
In 2013 Canadians reported the top 3 channels for giving were:
- 28% Place of Worship
- 23% Sponsoring Someone
- 22% Direct Mail
*Note: 12% Online
IN 2019 CAF reported:
- 44% made a cash donation
- 34% donated online using card payment
- 21% used a donation box
Note: You can participate in Stats Canada’s current survey on giving from Sept. 2023 to Mar.2024.
Why we give
In 2010 and 2013 Canadians were asked about their main reasons / motivations for giving were: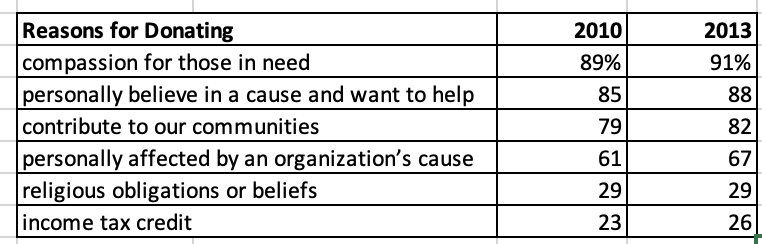
Donors’ research and surveys continue to show that people are more likely to give if they are aware of the need if they are asked to donate, if it makes them feel generous, and if they determine the personal benefits of the donation outweigh the costs. Other surveys such as 2017 CAF Canada (642 respondents) and 2018 Cygnus Study (12,064 donors) also reported motivations such as:
- I realize I can help make a difference (34%)
- It makes me feel good (32%)
- I trust the organization I donate to (39%)
- Increasing $ to charities whose work they deemed impressive (41%)
- Responding to a special request (29%) such as a capital campaign, in memoriam or for disaster relief
In the 2013 survey Canadians continued to be asked why they might not give more. They reported
- Happy with the amount given (73%)
- Can’t afford more (69%)
- Concerned about how $ used (29%)
- Didn’t like how requests were made (29%)
- Frequency of requests (29%)
- Tone (47%)
- Time of Day (14%)
- No one asked! (23%)
Ongoing research has also shown that to build long-lasting donor relationships, transparency and trust are also key issues. Imagine Canada standards require nonprofits to post their financials on their websites as donors are now more likely to report doing research before donating.

What Makes Us Give More?
- Lead Gifts (knowing others are giving) is shown to encourage participation and higher donation amounts
- Offering time-limited matching of gifts has been shown to increase overall giving
- As does suggesting “how much to give” vs. “whether to give”. Interestingly “formal” language vs. “colloquial” / conversational language was shown to lead to greater support.
- Charitable certification and positive reputation are shown to increase donations and donor trust
- Reaffirming donor’s identities are “charitable” or generous people increase donations
- As does reminding people of their past donations
- Using photographs that elicit emotion is shown to increase donations, as is the use of negatively framed appeals (e.g. describing hardships).
- Social incentives were often shown to be more effective than purely material incentives
The Pandemic did not significantly change giving behaviours
Most research into Pandemic Giving highlighted that many donors maintained their commitments to charities throughout the pandemic. This is again consistent with historical trends which have shown that those committed to causes continued to donate even during a global crisis or economic recession. What did change during the pandemic was that some donors shifted some giving away from global environmental and international causes to local social services. As news coverage often focused on giving to COVID-19 relief efforts and basic needs (e.g. food banks) this isn’t surprising that it influenced behaviours. Some studies (e.g. Blackbaud UK) also showed that donors had preferred to make individual transactions vs. subscription or monthly giving. North American research also showed that framing a donation solicitation as one in a series was shown to decrease donation amounts. While emergency appeals have always trended to one-time giving, this will be an interesting item to monitor as monthly giving is critical to many Canadina nonprofits.
While the long-term effects of the pandemic and global crises are still unfolding, the overall trend of fewer donors remains. In our next blog, we will be looking at changing consumer behaviours and how broader trends are impacting the sector. For example, economic reports show Canadians have withdrawn money from their RRSPs to cover living expenses or debt, demonstrating that a rising cost of living and debt burdens are putting financial pressure on many.
Helpful Canadian Donar Behaviour Stats & Sources
CIPC 2023 Survey Donor Behaviour and Preferences and Donor Relationships
KCI 2022 Community Organizations Sub-Sector Report
AFP 2021 Survey What Canadian Donors Want
Salesforce, NextAfter Recurring Giving Benchmark Study
and 2020 Charitable Giving Study – In Times of Crisis
Stats Canada SGVP / GSS 2018
2018 Penelope Burk / Cygnus Donor Survey – 2021 Report
Blackbaud 2018 Report on Generational Giving and
2023 Insights on Donor Behaviour Report: Canada
2018, Rideau Hall Foundation and Imagine Canada, Giving Behaviour of Canadians Report
Berkley 2018 White Paper on the Science of Generosity
Charities Aid Foundation of Canada 2017 Report on Giving
and 2021 Report on Giving
Imagine Canada, 2010 Data on Giving
We also referenced:
Ideas42 – 2023 Update on Giving and Charitable Behaviours as the report summarizes theoretical frameworks, models and studies.
Behavioural / Benchmarking Sources also include:
M+R Online Fundraising
Good Works Direct Mail
Nonprofit Source US Giving 2023 Stats