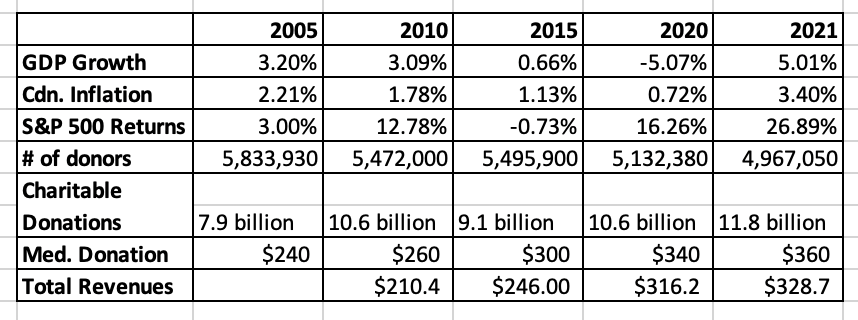
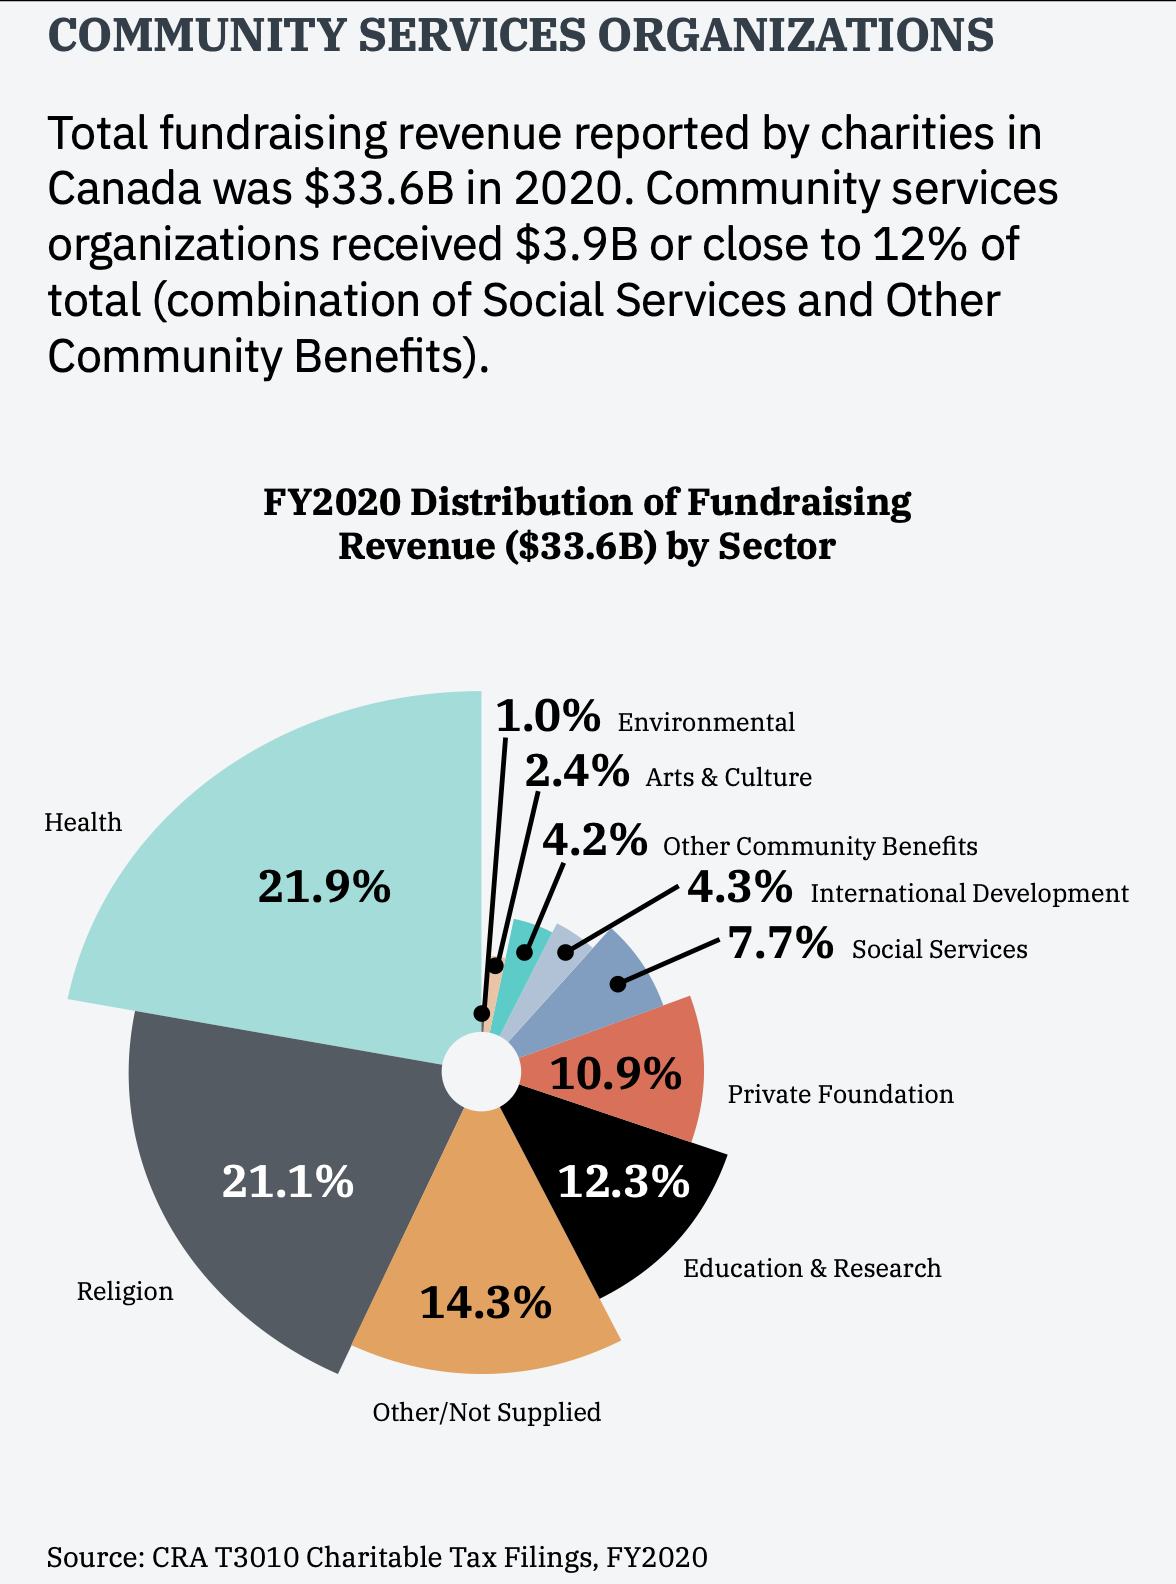
There are over 170,000 nonprofits in Canada and over 80,000 registered charities, whose registration means they can issue tax receipts for donations. In 2022 Stats Canada and the CRA released the most recent 2020 sector data which showed that 83,991 registered charities filed their T3010 tax returns. High-level summary reporting is also available (captured below) for 2021.
People are often surprised when I highlight that the NFP sector represents 9% of the total Canadian GDP (or $186 billion) – more than the retail trade industry ($106b in 2020) and close to the value of the mining, oil and gas extraction industry ($105b). It can be helpful to look at historical data alongside GDP and other economic indicators (e.g. recall the 2008 recession) as we look at trending data. Since the pandemic, most nonprofits have reported increasing demand for services and increasing costs to provide those services. While some nonprofits saw an increase in funding, not all nonprofits were equally as fortunate. As ONN reported in their recent article, “During economic downturns, individuals typically make less income and have reduced wealth available, so they decrease their charitable giving accordingly.”
Stats Canada also reported that 2.7 million Canadians are employed in the NFP sector (Fourth Quarter, 2022, up from approx. 2.2 million full-time jobs and over 200K part-time jobs in 2019) and in the most recent survey, over 24 million Canadians volunteered. (SGVP/GSS 2018 survey, released April 2021)

While total revenue for nonprofits has continued to grow (driven primarily by government transfers and sales of goods and services), for decades the number of Canadians making donations has declined. The amounts reported in tax returns for charitable donations have remained fairly flat at around $10 billion annually. While annual tax returns track only reported donations, the Survey on Giving, Volunteering and Participating (now done every 5 years) offers a comparison. For example in the 2018 GSS study, total donations were reported to be $11.9 billion, while tax returns totalled just over $9.9 billion. In our next post, we will look more deeply into changing consumer / donor behaviours.
It is also key when looking at data for the sector to consider reviewing data that doesn’t include “government” nonprofit institutions. The largest nonprofits in Canada account for over 60% of the revenues. Historically they are often referred to as M.U.S.H = Municipalities, Universities, Schools, Hospitals. In 2020 health and education “Government” nonprofits made up 75% of the sector’s GDP. This mix has remained relatively consistent since 2010.
- Health $88.9 billion (GDP)
- Education $50.5 billion
- Community Organizations $29.9 billion (e.g. social services, arts, culture, sports, civic, environmental protection, etc.)
- Business NFPs $16.4 (e.g. professional associations, unions)
While the CRA segments nonprofits into 4 categories for charitable registration (relief of poverty, religion, education, other) a more robust segmentation of Canadian nonprofits is available via Stats Canada and industry reporting. It is well worth looking at this subset of data across all reports as the diversity within the sector means it can be very difficult to compare apples-to-apples data. Some community organizations / charities run higher-cost lotteries and community events, while others have far fewer donors / corporate partners who make major donations. Others like United Way or granting Foundations, focus on fundraising and flow the funds to other community service organizations who do the work. Some government funding is tied directly to program delivery, but other funds could be transferred to co-create health education / awareness campaigns. Narrowing in on the sub-sector area you are familiar with will help provide factual data your team can benchmark against – and better orientate new board members / volunteers. KCI Insights produced a series of sub-sector reports in 2022.
In comparing where Canadians directed their funds – In both 2007 and 2015 the three key types of organizations to which donors gave the most were:
- Religious organizations (46% 2007 / 41% 2015) of all donated dollars followed by
- Health organizations (15% 2007 / 13% in 2015) and
- Social services organizations (10% in 2007 / 12% in 2015).
Newer reporting via platforms like Canada Helps continues to show these types of organizations still dominate. (2023, Giving by Category)
The next Survey on Giving (GSS) is being conducted by Stats Canada from Sept. 15, 2023 to March 30, 2024.
Be sure to add us to your news feed (https://brandrewire.ca/blog/) to see the upcoming series of articles on the NFP sector:
November 2023 – What do we know about Why Canadians Give? Changing Consumer / Donor Behaviours.
December 2023 – How can a P.E.S.T analysis help us as we prepare for 2024? And of course our Annual – What Key Trends we will be Discussing in 2024.

Helpful Canadian Non-Profit Stats & Sources
Imagine Canada Sector Monitor Surveys / Stats
https://www.imaginecanada.ca/en/research/sector-monitor
2016 Discussion Paper on Sustainable Funding
2022 Holiday Giving Survey
Statistics Canada
Stats Canada – Overview of the NFP sector 2010-2020
Stats Canada – Volunteering & Donating https://www150.statcan.gc.ca/n1/en/subjects/society_and_community/volunteering_and_donating
Table Tax Filers by Gender and Age https://www150.statcan.gc.ca/t1/tbl1/en/tv.action?pid=1110000201
Government of Canada – June 2019 Report to the Senate on the Charitable Sector
June 2020 Parlimentary Budget Office – Measuring Family Wealth in Canada / Major Giving
The Canadian Governments Advisory Committee on the Charitable Sector – July 2021 Report
Statista
https://www.statista.com/topics/2924/charitable-activities-in-canada/#topicOverview
Leading charities in Canada via revenue https://www.statista.com/statistics/556778/top-ten-registered-charities-in-canada-by-revenue/
Canada Helps – Giving Reports
Blackbaud Institute – Giving Reports
Check the International trends section included Canadian data vs. N/A

